Project Management for Middle School
The last couple of times I’ve assigned computer projects in class, I spent most of my time helping the same kids. Many kids gathered themselves into little informal workgroups, and they helped each other, shared ideas, looked up documentation, and were able to problem-solve pretty independently. But a good fraction of my students got stuck and just stayed stuck, and needed to be coaxed to find help. I spent a lot of time wondering how I could get all the kids to make high-functioning workgroups.
My husband is an engineering project manager, and he often says that his job is to remove obstacles for people. I’m the project manager for my seventh-grade classes, but I don’t even know what many of their obstacles are! I had to find a way that would help the kids work more independently and create a clear communication path so I would know when they were stuck and what was holding them up.
So I decided to formalize the “workgroup” idea. I asked the kids to sign up for groups of 3-6 people, on a big flipchart. These groups had important jobs:
- Be brainstorming partners, and help each other find ideas.
- If someone is stuck, show them how they can get un-stuck.
- Ask your workgroup for help, then ask another workgroup, then ask the teacher.
- Test each other’s programs.
- Groups would rotate working in certain locations, so no single group would always take the prime sunny spots in the room.
I talked with the class about how working on an engineering project involves important steps. You need to:
- Understand the requirements of the project (for school, this means reading the rubric and knowing how you’re graded).
- Get an idea for your project that meets the requirements.
- Develop your project.
- Refine your project.
- Test your project.
- Write the documentation (usually a paragraph).
- Go over the project with a critical friend who can make sure it meets the requirements and will get the grade you want.
To help the groups communicate with me so I knew where everyone was in the process, I told them about working in high-tech and how we have “status meetings”. At a status meeting, everyone goes around the room and says what they’re working on and what they need to move forward. For every work session, a workgroup gets a status report sheet to fill out. I clip a group’s status reports together, so I can easily flip through and check progress for the whole class.
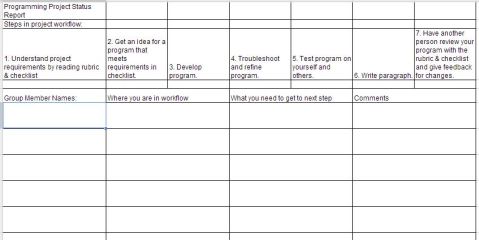
A status report. Click for the Google Doc
So far, I am really pleased with the workgroups. I have written brief notes on status reports and handed them back, with tips for how to move forward. I set an expectation that groups needed to be very welcoming to anyone that needed a group, and the kids have really risen to the occasion. Nobody is left out.
I did form beginner workgroups for students who are new to my class and have never coded before. I work with them for longer periods of time, and once they are more independent with programming, I’ll release them to other groups.
This feels like a good start to help the communication, and the kids really like that programming is a social and helpful activity. I can’t wait to see what they create next.
Congruence Transformations

Showcasing projects on Congruence Transformations
I had made the commitment to teaching my 7th grade math students how to code. I had chosen the tools and roughly mapped out the pacing for the year. It was time to dive in! The first unit my colleagues and I decided to attack was a geometry unit on Transformations.
- CCSS.Math.Content.8.G.A.2 Understand that a two-dimensional figure is congruent to another if the second can be obtained from the first by a sequence of rotations, reflections, and translations; given two congruent figures, describe a sequence that exhibits the congruence between them.
- CCSS.Math.Content.8.G.A.3 Describe the effect of dilations, translations, rotations, and reflections on two-dimensional figures using coordinates.
I started the kids on some programming exercises to find their way around the coordinate grid, drawing lines, and using colors. I hoped the early exposure to coordinate graphing would pay dividends later! I knew it would likely be confusing. I was throwing the kids into four-quadrant graphing, which they had never done before, and it was on a computer screen with its upside-down y-axis and no scale.
Day 1: I got the students signed on to Khan Academy and started them on teacher-led lessons on drawing lines. We focused just on a few commands: line(), stroke(), strokeWeight(). I required them to translate the origin to the center of the screen by using translate(200,200); first in their program. This would let them experiment with positive and negative numbers, reflections and rotations around the origin. It was difficult and very teacher-led. It was really hard for them to see the line() command consisted of four numbers, which were two x-y pairs of coordinates. They needed to connect a line to the previous one such that the second x-y pair from line 1 became the first x-y pair in line 2. The goals of “I can purposefully draw lines on a coordinate plane using technology” and “I can connect lines into polygons using technology” were tough indeed! By the end of a day, students had drawn shapes, but did they understand?
Day 2: We started congruence transformations with translations, so I put together some activities for students to do translations using programming. In middle school, the standards do not require students to really formalize the coordinate rules for transformations – but wouldn’t it be more motivating and relevant to problem-solve through translations using a program? I played with these tools.
VIDEO on doing translations with Khan Academy JavaScript
TROUBLESHOOTING activity – broken translations
FEEDBACK FORM – a check-for-understanding. How were the kids doing?
We filled more days with activities on rotations and reflections using textbook lessons, and then I got a brainstorm about a unit project.
Unit Project: The students wrote computer programs in JavaScript that contained at least two of the congruence transformations: reflections, rotations, and/or translations. They created original designs and wrote about them, using math vocabulary, in a document or presentation.
Project Description and Rubric
The students had a few half-days of work time on the project, with me and the paraprofessionals circulating and offering help. Many kids formed little informal workgroups, helping and consulting with each other, showing each other drafts, and sharing idea. I really need to explore this workgroup idea a little more – little mixed-ability groups of 3-6 students seemed just about right for accomplishing quite a bit of work. Some were more effective than others. I wondered a lot about how to help the less-effective groups and individuals develop those skills needed to become adventurous programmers – initiative, risk taking, pattern-finding, documentation-seeking, copying and tinkering.
When it was time to turn in the project, I wanted to make sharing it feel authentic and real – so I put the students into groups of four and had them take turns presenting their projects to each other. Every member had to give feedback to every other member using a special student rubric. I stapled all of the student feedback to mine at the end, with a grade on the project.
The presentations were very exciting! The kids loved showing off their work to their peers!

Groups of four presented their congruence designs to each other.
Sample Student Work: Here are some projects that really stood out.
Ashlyn C: PROGRAM and PRESENTATION. Ashlyn discovered (and explained nicely) that if you reverse the signs of the x-coordinates, a shape will reflect over the y-axis. She can also describe angles of rotation.
Lizzie P: PROGRAM and PRESENTATION. This is such an interesting project! Lizzie created little lines of reflectional symmetry in those purple clusters of grapes by paying careful attention to distances in the x direction and y direction. Her presentation isn’t completely accurate (she describes rotational symmetry that isn’t really rotational around the origin in the way she thinks it is), but she showed good general grasp of congruence transformations and how they affect corresponding points.
Abbi F: PROGRAM and PRESENTATION. Abbi caught on to translation transformations, even when working with negative numbers, better than just about anyone. She created a very pretty design and explained her transformations in great detail!
Reflections: Although this project was a lot of work, I noticed that I was able to keep pace with my colleagues who were doing work strictly on paper. I simply kept my paper lessons a little shorter, devoting about half of some block days to working on programming and the project.
At first, I did a lot of direct instruction. I am certain I overdid it! I made videos and walked students through how I wanted them to learn and interact with drawing.
They really learned a lot more when I just gave them the project, and without working with them on how to create rotations and reflections, just gave them instructions to play with the coordinates, look for patterns, keep track of what they did, and be able to describe the congruence transformations they made.
Here’s what I loved best about the transformations project: the kids really owned and understood the vocabulary and what it meant. Almost all of the students made “reflection”, “rotation”, “translation”, “congruence”, and “corresponding points” part of their everyday talk, and I heard them having conversations with each other about them. Their writing, in many cases, needed a lot of work. But if I interviewed them, they understood exactly what they were looking at and how they created it.
It was a first taste of project-based learning for me. I hadn’t taught them how to do what they did with technology – the students figured out how to make transformations when they needed to learn it. I was really energized by it, and even though the process was messy and definitely non-linear, I knew we had to code some more. By now, many students were demanding it!
Ratio and Proportion
In my seventh grade math classroom, the second unit we studied was on the power standard of “proportionality”. Students had learned about basic programming commands and how to use the coordinate grid. Their learning would be more powerful, I decided, if they had the opportunity to use the ideas of ratio and proportion with variables in a computer program. A common task is to scale quantities, or images, up or down to make sense of a situation. It’s a great fit for computer programming.
Standards:
- CCSS.Math.Content.7.RP.A.2 Recognize and represent proportional relationships between quantities.
- CCSS.Math.Content.7.RP.A.2b Identify the constant of proportionality (unit rate) in tables, graphs, equations, diagrams, and verbal descriptions of proportional relationships.
- CCSS.Math.Content.7.RP.A.2c Represent proportional relationships by equations. For example, if total cost t is proportional to the number n of items purchased at a constant price p, the relationship between the total cost and the number of items can be expressed as t = pn.
I really focused on the last standard, representing proportional relationships by equations. Variables are a new concept to middle-schoolers. It’s also one of the most important concepts in computer science, so there is great synergy there. I would focus on the use of variables and how you can use them to represent a proportional relationship. I wove these lessons in with our usual math lessons on proportionality.
1) Fractions, Ratios, and Rates starter: To give the students a chance to explore proportionality and how it can be represented graphically, I gave them three simple programming tasks: Draw 3/5 of a circle. Draw two rectangles in the ratio 1:2. Show with a diagram that I have taken 5 friends to a movie for a total cost of $75. The students needed to use the built-in documentation to learn how to draw arcs and rectangles, and work in workgroups to accomplish the task. It took about an entire 90-minute block, but almost everyone was successful.
FRACTIONS, RATIOS, and RATES starter program
2) Proportions and variables: Students had done a few activities involving variables and programming in the previous unit, so I wanted them to explore using variables in a proportional reasoning setting. I gave them the Population Program which is a troubleshooting activity. It shows two bars representing the populations of two cities, but one is clearly an incorrect length. I asked the students to fix the program so the bars correctly showed a comparison between the populations of the two towns.
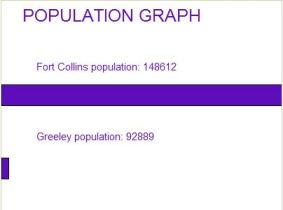
The activity had many correct ways of solving it, and a few incorrect ways that *looked* correct, which I didn’t anticipate at first! I found the populations of the two towns on Wikipedia, and conveniently, the population of Greeley is almost exactly 5/8 of the population of Fort Collins. The program starts with this code:
// the population of Fort Collins (Wikipedia)
var pop_ftc = 148612;
// the bar for Fort Collins goes all the way across the screen
var bar_ftc = 400;
// the population of Greeley (Wikipedia)
var pop_greeley = 92889;
// This looks wrong.How long should the bar be for Greeley?
var bar_greeley = 10;
In the picture, you can tell the bar for Greeley is way too short. The students started by adjusting the variable for “bar_greeley” until it looked about right. When looking at a visual, I was surprised at how good their estimation skills actually were when dealing with these numbers. Most students understood that Greeley’s population was more than half of Fort Collins’, but not more than 3/4, and they adjusted it approximately correctly. Some students just left it there and called it good.
One possible solution, which many students landed on, is to divide 148612 / 400 which tells you the scale factor from the bar to the population. In this case it’s about 371. They would then divide Greeley’s population by 371 and get about 250, which is a proportional length of the bar for Greeley.
Another possibility is to divide Greeley’s population by Fort Collins’ population, and notice that it gives you the ratio of 0.625. Greeley’s bar, then, must be 62.5% of the length of Fort Collins’ bar, so they could multiply 0.625 by 400 and get a correct length of 250 for Greeley’s bar.
A third possibility is to divide BOTH Fort Collins’ population and Greeley’s population by 400. This scales both populations down to number in the hundreds, and since you divided both populations by the same amount, the ratio remains the same (there’s a connection with equivalent fractions). Fort Collins’ bar changes to a length of 371 and Greeley’s is a length of 232.
So here’s the common mistake many students made which was devilish to sort out. They simply divided Greeley’s population by 400, because that number shows up in the program right above it. The result was 232. When you set the bar length for Greeley to 232, it *looks* correct. It’s more than half of Fort Collins’ bar, but not more than 3/4, and visually it seems just about right. But the ratio between the bars is now no longer the same as the ratio between the populations! The answer is close but the process is completely wrong. Helping students to sort out why this was a mistake was really tough when they’re still novices at abstract thinking.
Some students used variable expressions to solve it, but not many. It turned out mostly to be a calculator activity, which was fine because that’s where they were when we tried it. I LOVED that it tested their estimation skills and gave them instant visual feedback about whether they were on the right track. It taught me a lot about where they were with ratios and proportions. We had a great discussion.
3) Our final unit project was pretty open-ended, but I wanted it to be creative and fun. The students had to create some kind of diagram, based on real data, that would show proportionality. I showed them some examples and a rubric from a Google Doc, here.
RATES, RATIOS, and KHAN project
The project had some requirements that were non-negotiable. It had to use variables to represent quantities. The ratios had to be calculated using variable expressions. It needed to represent the data in a way that was proportional to the collected data. They had to explain what math they did, what they learned about proportionality, and why their graph was proportional to their original data.
The kids got really excited and started doing research. For many, they created tally sheets and did class surveys on whatever they were interested in : favorite sport, favorite color, number of pets. Some made Google forms to collect data. Others did research online about what they were interested in: annual salaries for their favorite careers, populations of cities, or the number of domestic pets in the country. Still others collected data in other ways: a popular project was to open a bag of candy and count the different colors.
Creating the graph with variables was more challenging for some kids than others, but it was extremely cool to see that moment when the light bulb went on and they realized the power of variable expressions. If the number of skittles is “s”, and your bar has a length of “s * 12”, you can modify the number of skittles and the bar changes proportionally. The other bars change proportionally. It’s funny how very exciting that little insight was.
Some kids really challenged themselves to do hard math by creating pie charts which require pretty complicated variable expressions. They were awesome projects.
Here are a few of the best ones.
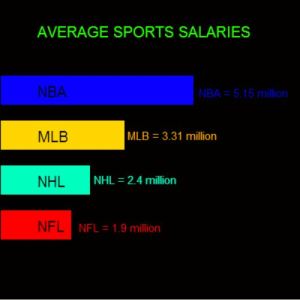
Sports Salaries by Jack C.
Hours Danced by Mackenzie L.
Art Supply Costs by Annabeth S.
Cook Vs. Photographer by Jace C.
I included Jace’s project for a reason. Jace struggles with writing and started off the year labeled as a struggling math student. He had a very difficult time with this project, but he was really engaged by the topic – he had been thinking a lot about becoming a cook or a photographer someday, and he was curious who made more money. He did a little internet research and determined a photographer makes about $250-500 for a really good photo, whereas a really good cook can make $140,000 a year. I sat down with him and conferred for a LONG time about what math needed to be in his program to make a graph reflecting the salaries. Using the data, how much would a cook make in a month? How many photographs could a photographer count on selling in a month? The bars went off the screen, so he played with scaling the bars down until they were both easily visible. Because he struggles with writing, it was a challenge to get all of the thoughts in paragraph form for how he did the project – so instead, I had him give a presentation to our math department about programming and what he learned. He did an INCREDIBLE job. He explained everything so thoroughly and carefully – he knew exactly why he did every operation and what it meant – he explained variables and how they worked, and gave the department a tour of Javascript and how to program. His most powerful insight? “Before this project, I didn’t really understand division, but now I do.”
I gave the students a survey to find out what they thought of the Rates and Ratios project. 68 students answered the survey. The project was:

Survey of what students thought of the project
The most popular response was “fun” which about 2/3 of the students gave. I don’t have reference data to see what students think of non-programming math projects: are they fun? But I was encouraged by the results and really loved what this project did for my students when it came to proportional reasoning and variable expressions.
Inequalities
Sample student work using inequalities to create boolean expressions for button-clicking fun!
It’s been a great start to second semester, and I am continuing to add coding lessons to my Common Core 7th grade math classroom! For the first week back, the topic was inequalities. Inequalities have applications in computer programming that can allow your programs to branch and make decisions – making coding more interactive and fun!
Common Core / Coding lesson relating to:
- CCSS.Math.Content.6.EE.B.8 Write an inequality of the form x > c or x < c to represent a constraint or condition in a real-world or mathematical problem. Recognize that inequalities of the form x > c or x < c have infinitely many solutions; represent solutions of such inequalities on number line diagrams.
- CCSS.Math.Content.7.EE.B.4b Solve word problems leading to inequalities of the form px +q > r or px + q < r, where p, q, and r are specific rational numbers. Graph the solution set of the inequality and interpret it in the context of the problem. For example: As a salesperson, you are paid $50 per week plus $3 per sale. This week you want your pay to be at least $100. Write an inequality for the number of sales you need to make, and describe the solutions.
Background: It’s a new semester and we’re starting a new unit on Equations, Expressions, and Inequalities. I made a quick decision to start the unit with inequalities. Last year, inequalities were taught last in the unit, and it felt disconnected from the rest of the learning. I didn’t feel I taught it well. My thinking is that this year, if I start with the symbols and vocabulary of inequalities and weave them in throughout the entire unit, they can be given equal treatment with equations and equivalent expressions. As far as I know, the kids really did not get much exposure to inequalities last year, so I need to work with them on the 6th grade and 7th grade expectations, which is fine. They’re really similar.
Lesson:
1) I started with some notes to have the students capture vocabulary, symbols, and graphing. We do the exercises on page 1 and 2 as group activities or pair/shares with whole-class discussion afterward.
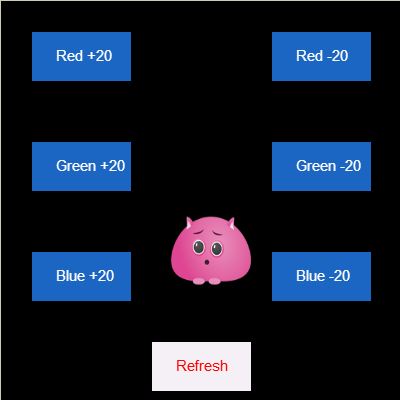
On pages 3-4, I bring in boolean expressions, which are an application of inequalities. In computer programming, inequalities have the potential to introduce something really fun for the kids, because they can turn a bounded region on the canvas into a BUTTON! The notes demonstrate using boolean expressions to define (x,y) coordinates on a plane that would satisfy all of the inequalities in them. On the last page, there is an example JavaScript program (I introduced it as a “skeleton” program and filled in the blanks as a whole-class activity) that kids can type in, and they’ll get a rectangle on the screen that becomes a button you can press.
NOTES: inequality_notes
NOTES FILLED IN: inequality_notes_completed
2) On day 2, We started with inequality warm-ups. We then went to Khan Academy and clicked on Create a New Program. I tasked the kids with entering the sample program, and then problem-solving to add a second button that they create – or other interesting features that involve a mouse click and inequalities. I graded them on effort only, as I don’t believe in assessing practice.
WARM-UP: inequality_warmups
EXAMPLE JAVASCRIPT PROGRAM: HERE
3) On day 3, I assigned a set of exercises on Khan Academy, and then had them continue work on their “button” programs. Some of the kids produced amazing work. Some produced adequate work. Almost everyone produced something, and in conferring with kids, I think they are getting the hang of inequalities nicely.
EXERCISES: INEQUALITIES ON A NUMBER LINE
Sample Student Work:
Thank You Button by Grace W.
Fortune Teller by Keaton S.
Scavenger Hunt by Sam C.
Color Changer by Anna R.
4) On day 4, I assigned one more set of exercises on Khan Academy and gave a homework assignment on inequalities on a number line. I can’t post the assignment due to copyright issues. While we’re ramping down the writing and graphing of simple inequalities, we are concurrently ramping up writing expressions, combining like terms, and studying the distributive property. We will continue to weave inequalities into our work as we work with equations!
EXERCISES: INEQUALITIES IN ONE VARIABLE 1
5) On Day 5, we moved full-steam into other activities having to do with writing equivalent expressions, a different standard (which, perhaps, will contain more coding activities!). I did do a 15-minutes warm-up: A wreck-it Ralph activity in which students had to debug a program and get it working. I used this one. We did this whole-class, but I wondered if it would make sense in groups. I believe it would have taken more time, but would have been more engaging this way.
Troubleshooting: Broken Button-Click Program
Reflection: On the positive side, engagement – engagement – engagement! Kids get so excited by making their computer programs interactive. They were even bought in to the inequality activities involving graphing and note-taking because they felt it had a purpose for learning more about computing. For the first time, I had a number of kids that stayed up late working on programs because they had a great idea they couldn’t let go. They e-mailed me for help over the weekend. Another positive is that kids have settled into work groups that help each other with the programming. Some work groups are more high-functioning than others, but since I have some that are very high-functioning, I can focus on the ever-shrinking number of kids who are pretty lost.
On the negative side, the math of boolean expressions is really slow in coming. My classes are so big – if I had time to confer for ten minutes with every student, one-on-one, my job would be much easier. JavaScript is a difficult language to learn for newcomers, and they are not used to thinking about matching the curly braces {}, where to add the semicolons, and making sure every open parenthesis ( is matched by a closed parenthesis ). These troubles are growing with the addition of functions and “if” statements.
I think I can work through some of these negatives by doing a couple of “wreck-it Ralph” troubleshooting activities to help students with the syntax of JavaScript. Debugging someone else’s program is a powerful tool.
Ongoing: I am looking for a way to tie in a unit project in which students can create their own innovation using inequalities and equivalent expressions! I have not yet worked out the details, and I am open to suggestions!

Recent Comments